Market Outlook
June 19, 2017
Market Cues
Domestic Indices
Chg (%)
(Pts)
(Close)
Indian markets are likely to open positive tracking the SGX Nifty and Asian markets.
BSE Sensex
(0.1)0.3
(19)86
31,056
US markets had a mixed session, which saw poor economic data along with a
Nifty
0.10.4
1033
9,5886
merger announcement between Amazon and Whole Foods. The U.S. Commerce
Mid Cap
0.20.7
2695
14,807
Department said housing starts slumped by 5.5 percent to an annual rate of 1.092
Small Cap
0.11.1
2171
15,667
million in May from the revised April estimate of 1.156 mln. This decline was much
lower than estimates which was a gain of 1.215 mln from 1.172 mln.
Bankex
0.5
127
26,589
UK stocks had a positive session as the next round of financing for the Greek
Global Indices
Chg (%)
(Pts)
(Close)
government was approved by Eurozone ministers BP Plc closed up about 1 percent
on news of its plans to invest $6bln in the D6 gasfield in the KG Basin along with
Dow Jones
0.10.9
2474
21,384
Reliance Industries. Retailer Tesco tumbled 4.92 percent, despite posting its strongest
Nasdaq
(0.2)0.9
(14)54
6,1527
U.K. sales growth in seven years.
FTSE
0.60.1
44
4
7,4649
Nikkei
0.60.0)
111
(2)
19,943
Indian markets closed flat during a choppy session. IT and healthcare stocks lost
ground and closed down 0.83 and 1.52 percent respectively. The Bank index closed
Hang Seng
0.21.0
6131
25,626
up 0.48%.
Shanghai Com
(0.3)0.0
(9)
1
3,1232
News Analysis
Advances / Declines
BSE
NSE
IPCA Labs - USFDA update
Advances
1,339
1,889
Detailed analysis on Pg2
Declines
1,351
805
Investor’s Ready Reckoner
Unchanged
154
71
Key Domestic & Global Indicators
Volumes (` Cr)
Stock Watch: Latest investment recommendations on 150+ stocks
Refer Pg5 onwards
BSE
4,650
NSE
27,168
Top Picks
CMP
Target
Upside
Company
Sector
Rating
(`)
(`)
(%)
#Net Inflows (` Cr)
Net
Mtd
Ytd
Blue Star
Capital Goods
Accumulate
671
760
13.3
FII
(610)
2,891)
54,859
Dewan Housing Fin. Financials
Accumulate
455
520
14.3
MFs
238
3,636
33,675
Mahindra Lifespace Real Estate
Buy
440
522
18.7
Navkar Corporation Others
Buy
221
265
20.1
KEI Industries
Capital Goods
Buy
220
258
17.1
Top Gainers
Price (`)
Chg (%)
More Top Picks on Pg3
Abancem
194
11.6
Fsl
33
8.0
Key Upcoming Events
Previous
Consensus
Beml
1,455
7.7
Date
Region
Event Description
Reading
Expectations
Gmdcltd
156
6.9
Jun 21, 2017 US
Existing home sales
5.57
5.55
Gvkpil
6
4.7
Jun 22, 2017 US
Initial Jobless claims
237.00
240.00
Jun 22, 2017 Germany PMI Services
55.40
55.40
Jun 23, 2017 Euro Zone Euro-Zone Consumer Confidence
(3.30)
(3.00)
Top Losers
Price (`)
Chg (%)
Jun 23, 2017 Germany PMI Manufacturing
59.50
59.00
Amtekauto
229
(12.3)
Jun 23, 2017 US
GDP Qoq (Annualised)
1.20
1.20
Ipcalab
472
(8.1)
More Events on Pg4
Videoind
22
(4.9)
Lupin
1,131
(4.4)
Fortis
191
(3.6)
#as on 16t June, 2017
Market Outlook
June 19, 2017
News Analysis
IPCA Labs - USFDA update
IPCA Labs got a jolt from USFDA both for its API and Formulations facilities.
USFDA stated that all the drugs manufactured from the company's manufacturing
formulations units situated at SEZ Indore (Pithampur) and Piparia (Silvassa) be
henceforth refused admission into the United States (without any exception) until
the Company can demonstrate that the drugs manufactured from these
manufacturing sites and intended for the US market are in compliance with cGMP.
Also, the company has received a communication from USFDA stating that all the
drugs manufactured at the Ratlam (Madhya Pradesh) will be refused admission
into United States (except API' Chloroquine Phosphate, which exception will be
reconsidered if, shortage and/or medical necessity implications change) until the
company can demonstrate that the drugs manufactured at this manufacturing site
and intended for the US market are in compliance with cGMP.
This is a significant blow to the company’s effort to get its facilities out of the
USFDA import alerts. With this we believe that the timelines for IPCA labs to revive
its USFDA business have prolonged. According to the FY2016 Annual Report, USA
constituted sales of around `260cr, constituting around 19% of overall exports of
the company and around 9% overall sales. While we would be working on new
estimates, we believe that development will have an impact on the FY2018 and
FY2019 estimates to the extent of 8-9% reduction in the net profit numbers. Also,
in near term, given the development, the company’s financial performance will be
more driven by its performance in the domestic markets. We think in the current
scenario, the fair value of the stock should be around `620.
Economic and Political News
During 2014-17, India saw a 142 percent YoY increase in mobile data
consumption per subscriber: NITI Aayog
Central Government sets target of doubling the farmers' income by 2022 in
the next five years
DoT tells FinMin to reduce projection of FY18 telecom revenue target by 40%
Corporate News
Kotak Mahindra Bank's stake buy in insurance arm gets CCI approval
Indian Oil successfully rolls out daily revision of petrol, diesel prices
SBI looking to increase corporate lending in Europe
Market Outlook
June 19, 2017
Top Picks
Market Cap
CMP
Target
Upside
Company
Rationale
(` Cr)
(`)
(`)
(%)
Strong growth in domestic business due to its leadership
in acute therapeutic segment. Alkem expects to launch
Alkem Laboratories
22,494
1,881
2,161
14.9
more products in USA, which bodes for its international
business.
We expect the company would report strong profitability
Asian Granito
1,249
415
447
7.7
owing to better product mix, higher B2C sales and
amalgamation synergy.
Favourable outlook for the AC industry to augur well for
Cooling products business which is out pacing the market
Blue Star
6,411
671
760
13.3
growth. EMPPAC division's profitability to improve once
operating environment turns around.
With a focus on the low and medium income (LMI)
consumer segment, the company has increased its
Dewan Housing Finance
14,251
455
520
14.3
presence in tier-II & III cities where the growth opportunity
is immense.
Loan growth is likely to pick up after a sluggish FY17.
Karur Vysya Bank
8,995
149
160
7.5
Lower credit cost will help in strong bottomline growth.
Increasing share of CASA will help in NIM improvement.
Economic recovery to have favourable impact on
advertising & circulation revenue growth. Further, the
Jagran Prakashan
6,025
184
225
22.1
acquisition of a radio business (Radio City) would also
boost the company's revenue growth.
High order book execution in EPC segment, rising B2C
KEI Industries
1,715
220
258
17.1
sales and higher exports to boost the revenues and
profitability
Speedier execution and speedier sales, strong revenue
Mahindra Lifespace
2,256
440
522
18.7
visibilty in short-to-long run, attractive valuations
Massive capacity expansion along with rail advantage at
Navkar Corporation
3,146
221
265
20.1
ICD as well CFS augurs well for the company
Strong brands and distribution network would boost
Siyaram Silk Mills
2,100
2,240
2,500
11.6
growth going ahead. Stock currently trades at an
inexpensive valuation.
Market leadership in Hindi news genre and no.
2
viewership ranking in English news genre, exit from the
TV Today Network
1,546
259
344
32.8
radio business, and anticipated growth in ad spends by
corporates to benefit the stock.
Source: Company, Angel Research
Market Outlook
June 19, 2017
Key Upcoming Events
Global economic events release calendar
Bloomberg Data
Date
Time
Country
Event Description
Unit
Period
Last Reported
Estimated
7:30 PMUS
Existing home sales
Million
May
5.57
5.55
Jun 21, 2017
Jun 22, 2017
6:00 PMUS
Initial Jobless claims
Thousands
Jun 17
237.00
240.00
1:00 PMGermany PMI Services
Value
Jun P
55.40
55.40
Jun 23, 2017
7:30 PMEuro Zone Euro-Zone Consumer Confidence
Value
Jun A
(3.30)
(3.00)
1:00 PMGermany PMI Manufacturing
Value
Jun P
59.50
59.00
6:00 PMUS
GDP Qoq (Annualised)
% Change
1Q T
1.20
1.20
Jun 27, 2017
7:30 PMUS
New home sales
Thousands
May
569.00
590.50
Jun 29, 2017
7:30 PMUS
Consumer Confidence
S.A./ 1985=100 Jun
117.90
117.50
Jun 30, 2017
1:25 PMGermany Unemployment change (000's)
Thousands
Jun
(9.00)
6:30 AMChina
PMI Manufacturing
Value
Jun
51.20
2:00 PMUK
GDP (YoY)
% Change
1Q F
2.00
Jul 03, 2017
2:00 PMUK
PMI Manufacturing
Value
Jun
56.70
Jul 07, 2017
2:00 PMUK
Industrial Production (YoY)
% Change
May
(0.80)
6:00 PMUS
Change in Nonfarm payrolls
Thousands
Jun
138.00
6:00 PMUS
Unnemployment rate
%
Jun
4.30
Jul 10, 2017
India
Imports YoY%
% Change
Jun
33.10
India
Exports YoY%
% Change
Jun
8.30
2:00 PMUK
Jobless claims change
% Change
Jun
7.30
Jul 12, 2017
7:00 AMChina
Consumer Price Index (YoY)
% Change
Jun
1.50
5:30 PMIndia
Industrial Production YoY
% Change
May
3.10
Jul 13, 2017
US
Producer Price Index (mom)
% Change
Jun
(0.70)
China
Exports YoY%
% Change
Jun
8.70
Source: Bloomberg, Angel Research
Market Outlook
June 19, 2017
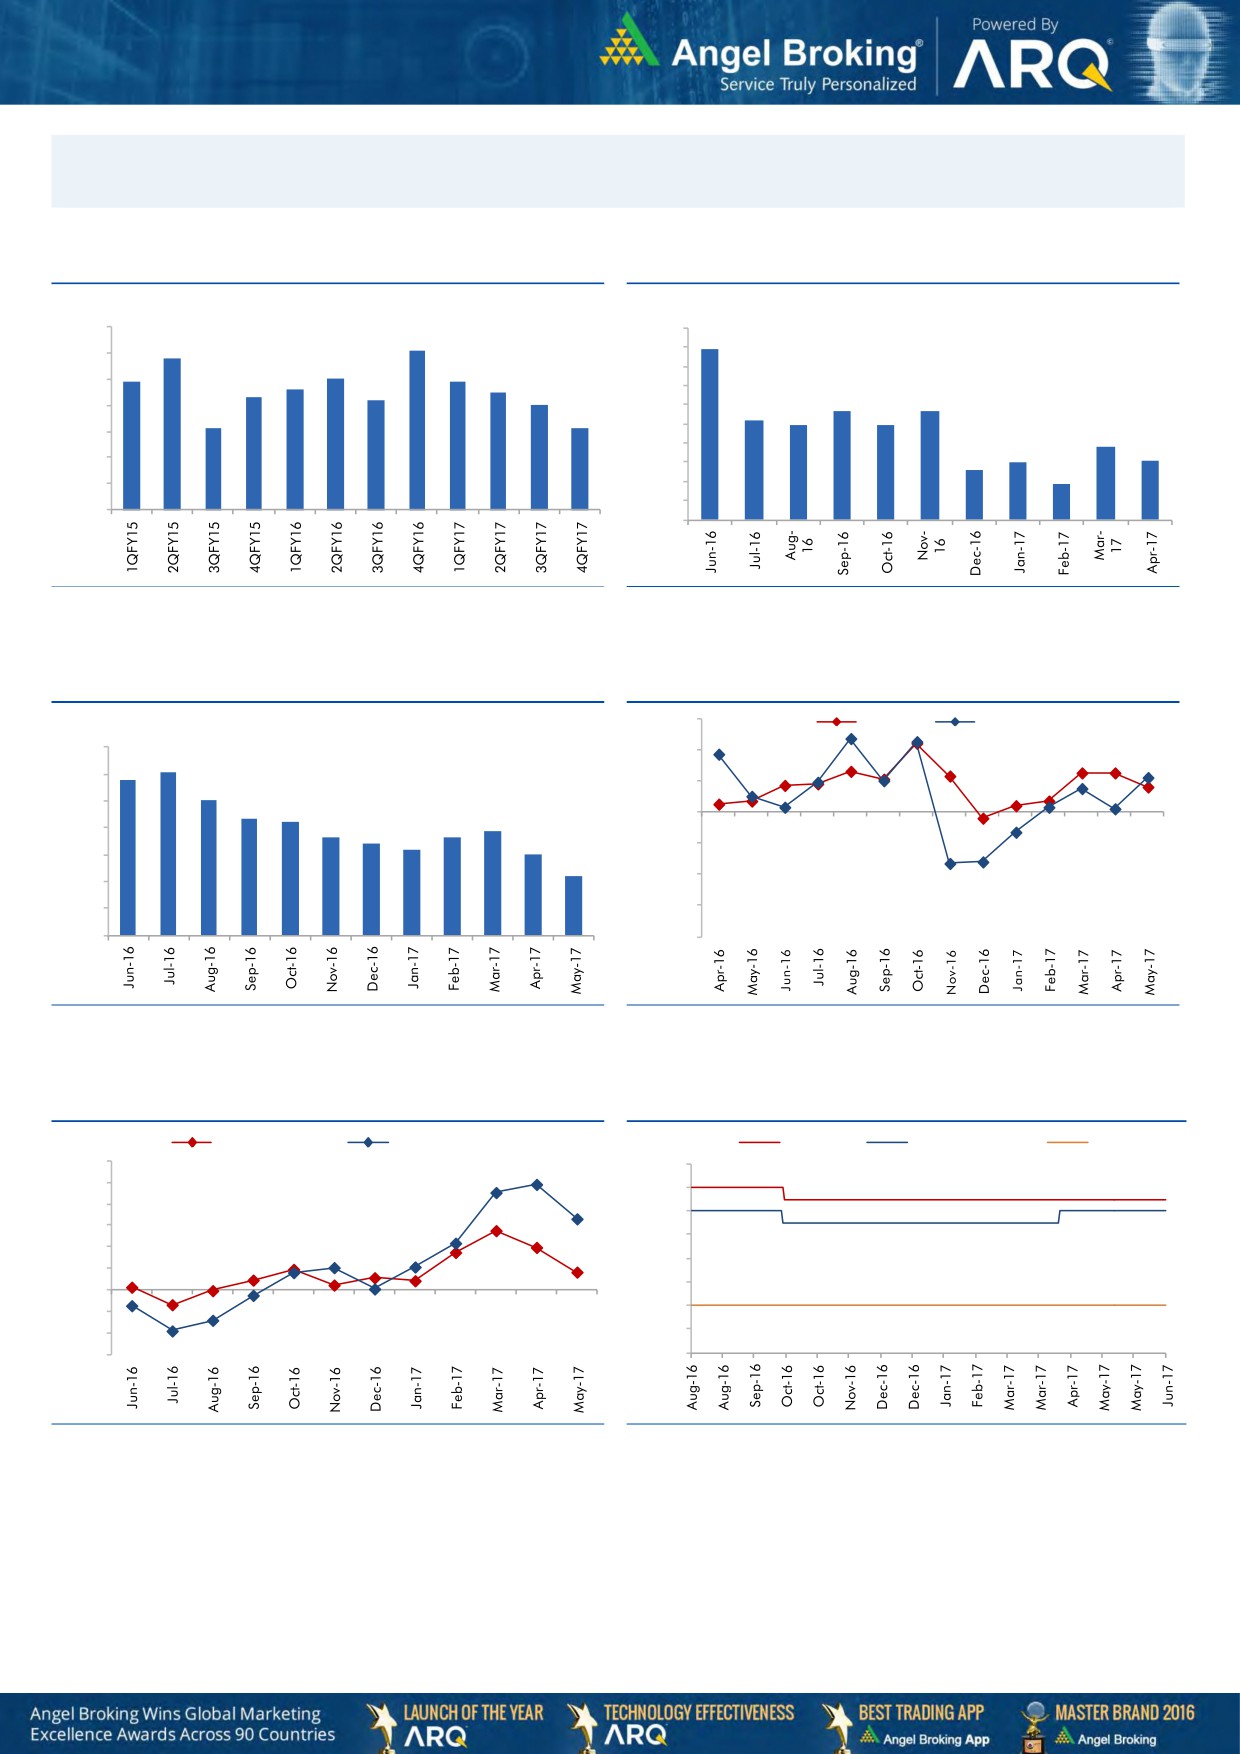
Macro watch
Exhibit 1: Quarterly GDP trends
Exhibit 2: IIP trends
(%)
(%)
10.0
10.0
9.1
8.9
8.8
9.0
9.0
7.9
8.0
7.9
8.0
7.6
7.5
8.0
7.3
7.2
7.0
7.0
5.7
5.7
7.0
6.0
5.2
6.1
6.1
4.9
4.9
6.0
5.0
3.8
4.0
3.0
3.1
2.6
5.0
3.0
1.9
4.0
2.0
1.0
3.0
-
Source: CSO, Angel Research
Source: MOSPI, Angel Research
Exhibit 3: Monthly CPI inflation trends
Exhibit 4: Manufacturing and services PMI
56.0
Mfg. PMI
Services PMI
(%)
7.0
54.0
6.1
5.8
6.0
5.1
52.0
5.0
4.3
4.2
3.9
50.0
3.6
3.7
4.0
3.4
3.2
3.0
48.0
3.0
2.2
46.0
2.0
1.0
44.0
-
42.0
Source: MOSPI, Angel Research
Source: Market, Angel Research; Note: Level above 50 indicates expansion
Exhibit 5: Exports and imports growth trends
Exhibit 6: Key policy rates
(%)
Exports yoy growth
Imports yoy growth
(%)
Repo rate
Reverse Repo rate
CRR
60.0
7.00
50.0
6.50
40.0
6.00
30.0
5.50
20.0
5.00
10.0
4.50
0.0
4.00
(10.0)
(20.0)
3.50
(30.0)
3.00
Source: Bloomberg, Angel Research
Source: RBI, Angel Research
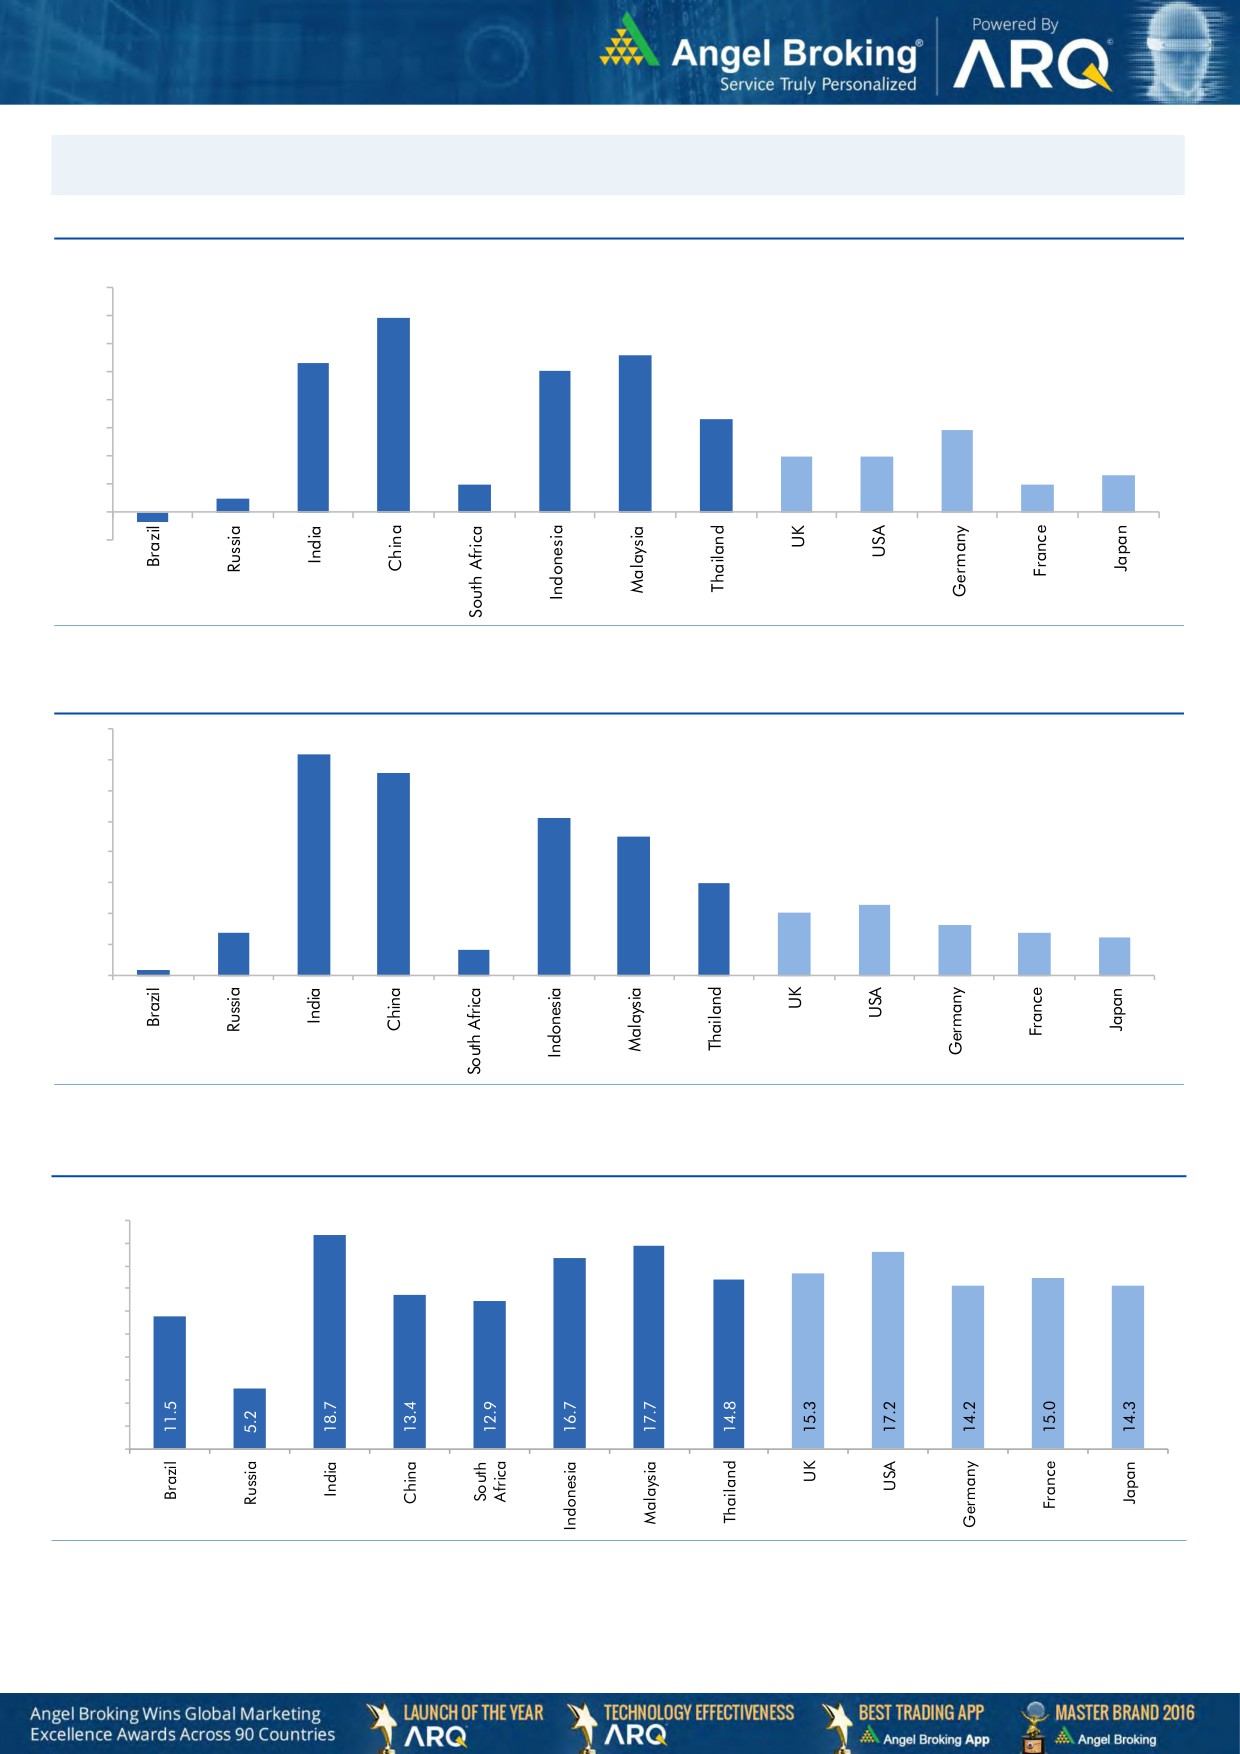
Market Outlook
June 19, 2017
Global watch
Exhibit 1: Latest quarterly GDP Growth (%, yoy) across select developing and developed countries
(%)
8.0
6.9
7.0
5.6
6.0
5.3
5.0
1.0
5.0
4.0
3.3
2.9
3.0
2.0
2.0
0.5
2.0
1.0
1.3
1.0
-
(1.0)
(0.4)
Source: Bloomberg, Angel Research
Exhibit 2: 2016 GDP Growth projection by IMF (%, yoy) across select developing and developed countries
(%)
7.2
7.0
6.6
6.0
5.1
5.0
4.5
4.0
3.0
3.0
2.3
2.0
1.4
1.6
2.0
1.4
1.2
0.2
0.8
1.0
-
Source: IMF, Angel Research
Exhibit 3: One year forward P-E ratio across select developing and developed countries
(x)
20.0
18.0
16.0
14.0
12.0
10.0
8.0
6.0
4.0
2.0
-
Source: IMF, Angel Research
Market Outlook
June 19, 2017
Exhibit 4: Relative performance of indices across globe
Returns (%)
Country
Name of index
Closing price
1M
3M
1YR
Brazil
Bovespa
61,626
(10.3)
(4.7)
26.7
Russia
Micex
1,823
(8.5)
(8.9)
(4.2)
India
Nifty
9,588
0.7
5.5
18.2
China
Shanghai Composite
3,123
0.6
(3.3)
6.6
South Africa
Top 40
44,512
(6.1)
0.5
(4.1)
Mexico
Mexbol
49,221
1.0
4.5
8.6
Indonesia
LQ45
961
2.2
7.5
14.5
Malaysia
KLCI
1,791
0.7
4.3
8.1
Thailand
SET 50
992
0.8
1.7
8.5
USA
Dow Jones
21,384
1.9
2.1
21.0
UK
FTSE
7,464
(0.8)
1.4
20.3
Japan
Nikkei
19,943
0.6
1.7
19.6
Germany
DAX
12,753
(0.4)
6.4
26.6
France
CAC
5,263
(1.0)
5.6
28.2
Source: Bloomberg, Angel Research
Stock Watch
June 19, 2017
Company Name
Reco
CMP
Target
Mkt Cap
Sales ( Čcr )
OPM(%)
EPS (Č)
PER(x)
P/BV(x)
RoE(%)
EV/Sales(x)
(Č)
Price ( Č)
( Č cr )
FY17E FY18E
FY17E
FY18E
FY17E
FY18E
FY17E
FY18E
FY17E
FY18E
FY17E
FY18E
FY17E
FY18E
Agri / Agri Chemical
Rallis
Sell
248
209
4,820
1,937
2,164
13.3
14.3
9.0
11.0
27.5
22.5
4.8
4.2
18.4
19.8
2.5
2.2
United Phosphorus
Neutral
868
-
44,095
15,176
17,604
18.5
18.5
37.4
44.6
23.2
19.5
4.6
3.8
21.4
21.2
3.0
2.6
Auto & Auto Ancillary
Ashok Leyland
Buy
94
111
26,794
20,021
21,915
11.6
11.9
4.5
5.3
20.9
17.7
4.3
3.8
20.6
21.5
1.3
1.1
Bajaj Auto
Neutral
2,809
-
81,282
25,093
27,891
19.5
19.2
143.9
162.5
19.5
17.3
5.5
4.7
30.3
29.4
3.0
2.6
Bharat Forge
Neutral
1,183
-
27,538
7,726
8,713
20.5
21.2
35.3
42.7
33.5
27.7
6.2
5.6
18.9
20.1
3.6
3.2
Eicher Motors
Neutral
28,747
-
78,255
16,583
20,447
17.5
18.0
598.0
745.2
48.1
38.6
16.4
12.5
41.2
38.3
4.5
3.6
Gabriel India
Neutral
152
-
2,186
1,544
1,715
9.0
9.3
5.4
6.3
28.2
24.2
5.3
4.7
18.9
19.5
1.4
1.2
Hero Motocorp
Neutral
3,778
-
75,453
28,083
30,096
15.3
15.7
171.8
187.0
22.0
20.2
7.7
6.5
30.1
27.9
2.5
2.3
Jamna Auto Industries Neutral
273
-
2,176
1,486
1,620
9.8
9.9
15.0
17.2
18.2
15.9
4.0
3.4
21.8
21.3
1.5
1.4
L G Balakrishnan & Bros Neutral
747
-
1,173
1,302
1,432
11.6
11.9
43.7
53.0
17.1
14.1
2.4
2.2
13.8
14.2
1.0
0.9
Mahindra and Mahindra Neutral
1,389
-
86,242
46,534
53,077
11.6
11.7
67.3
78.1
20.6
17.8
3.4
2.9
15.4
15.8
1.8
1.6
Maruti
Neutral
7,266
-
219,503
67,822
83,288
16.0
16.4
253.8
312.4
28.6
23.3
6.6
5.3
23.0
22.9
2.9
2.3
Minda Industries
Neutral
591
-
5,109
2,728
3,042
9.0
9.1
68.2
86.2
8.7
6.9
2.0
1.6
23.8
24.3
1.9
1.7
Motherson Sumi
Neutral
475
-
66,591
45,896
53,687
7.8
8.3
13.0
16.1
36.4
29.5
11.7
9.4
34.7
35.4
1.5
1.3
Rane Brake Lining
Neutral
1,376
-
1,089
511
562
11.3
11.5
28.1
30.9
49.0
44.5
7.5
6.8
15.3
15.0
2.3
2.1
Setco Automotive
Neutral
38
-
504
741
837
13.0
13.0
15.2
17.0
2.5
2.2
0.4
0.4
15.8
16.3
1.1
1.0
Tata Motors
Neutral
456
-
131,519
300,209
338,549
8.9
8.4
42.7
54.3
10.7
8.4
1.7
1.4
15.6
17.2
0.6
0.5
TVS Motor
Neutral
550
-
26,139
13,390
15,948
6.9
7.1
12.8
16.5
43.1
33.3
10.7
8.5
26.3
27.2
2.0
1.7
Amara Raja Batteries
Buy
840
1,009
14,349
5,305
6,100
16.0
16.3
28.4
34.0
29.6
24.7
5.7
4.8
19.3
19.3
2.7
2.3
Exide Industries
Neutral
222
-
18,857
7,439
8,307
15.0
15.0
8.1
9.3
27.4
23.9
3.8
3.4
14.3
16.7
2.2
1.9
Apollo Tyres
Neutral
255
-
13,000
12,877
14,504
14.3
13.9
21.4
23.0
11.9
11.1
1.9
1.6
16.4
15.2
1.2
1.1
Ceat
Neutral
1,861
-
7,527
7,524
8,624
13.0
12.7
131.1
144.3
14.2
12.9
2.6
2.2
19.8
18.6
1.1
0.9
JK Tyres
Neutral
173
-
3,916
7,455
8,056
15.0
15.0
21.8
24.5
7.9
7.1
1.7
1.4
22.8
21.3
0.7
0.6
Swaraj Engines
Neutral
2,362
-
2,934
660
810
15.2
16.4
54.5
72.8
43.3
32.5
13.5
12.3
31.5
39.2
4.3
3.5
Subros
Neutral
261
-
1,566
1,488
1,681
11.7
11.9
6.4
7.2
40.8
36.4
4.3
3.9
10.8
11.4
1.3
1.1
Indag Rubber
Neutral
222
-
581
286
326
19.8
16.8
11.7
13.3
18.9
16.6
3.2
3.0
17.8
17.1
1.7
1.5
Capital Goods
ACE
Neutral
74
-
728
709
814
4.1
4.6
1.4
2.1
52.5
35.0
2.2
2.0
4.4
6.0
1.2
1.0
BEML
Neutral
1,455
-
6,061
3,451
4,055
6.3
9.2
31.4
57.9
46.4
25.1
2.8
2.5
6.3
10.9
1.9
1.6
Bharat Electronics
Neutral
170
-
37,916
8,137
9,169
16.8
17.2
58.7
62.5
2.9
2.7
0.5
0.4
44.6
46.3
3.6
3.3
Stock Watch
June 19, 2017
Company Name
Reco
CMP
Target
Mkt Cap
Sales ( Čcr )
OPM(%)
EPS (Č)
PER(x)
P/BV(x)
RoE(%)
EV/Sales(x)
(Č)
Price ( Č)
( Č cr )
FY17E
FY18E
FY17E
FY18E
FY17E
FY18E
FY17E
FY18E
FY17E
FY18E
FY17E
FY18E
FY17E
FY18E
Capital Goods
Voltas
Neutral
489
-
16,180
6,511
7,514
7.9
8.7
12.9
16.3
37.9
30.0
6.8
6.0
16.7
18.5
2.2
1.9
BGR Energy
Neutral
159
-
1,146
16,567
33,848
6.0
5.6
7.8
5.9
20.4
26.9
1.2
1.1
4.7
4.2
0.2
0.1
BHEL
Neutral
139
-
33,899
28,797
34,742
-
2.8
2.3
6.9
60.2
20.1
1.0
1.0
1.3
4.8
0.8
0.6
Blue Star
Accumulate
671
760
6,411
4,283
5,077
5.9
7.3
14.9
22.1
45.0
30.3
8.7
7.4
20.4
26.4
1.5
1.3
CG Power and Industrial
Neutral
83
-
5,215
5,777
6,120
5.9
7.0
3.3
4.5
25.2
18.5
1.1
1.1
4.4
5.9
0.9
0.7
Solutions
Greaves Cotton
Neutral
162
-
3,944
1,755
1,881
16.8
16.9
7.8
8.5
20.7
19.0
4.1
3.9
20.6
20.9
1.9
1.8
Inox Wind
Neutral
145
-
3,211
5,605
6,267
15.7
16.4
24.8
30.0
5.8
4.8
1.6
1.2
25.9
24.4
0.6
0.5
KEC International
Neutral
254
-
6,536
9,294
10,186
7.9
8.1
9.9
11.9
25.7
21.4
3.8
3.3
15.6
16.3
0.9
0.9
KEI Industries
Buy
220
258
1,715
2,633
3,001
10.4
10.0
12.7
13.0
17.3
16.9
3.7
3.1
21.4
18.2
0.8
0.8
Thermax
Neutral
966
-
11,506
5,421
5,940
7.3
7.3
25.7
30.2
37.6
32.0
4.5
4.2
12.2
13.1
2.0
1.8
VATech Wabag
Neutral
711
-
3,881
3,136
3,845
8.9
9.1
26.0
35.9
27.4
19.8
3.4
2.9
13.4
15.9
1.1
0.9
Cement
ACC
Neutral
1,636
-
30,718
11,225
13,172
13.2
16.9
44.5
75.5
36.8
21.7
3.5
3.2
11.2
14.2
2.7
2.3
Ambuja Cements
Neutral
237
-
47,109
9,350
10,979
18.2
22.5
5.8
9.5
40.9
25.0
3.4
3.1
10.2
12.5
5.0
4.3
India Cements
Neutral
220
-
6,763
4,364
4,997
18.5
19.2
7.9
11.3
27.9
19.5
2.0
2.0
8.0
8.5
2.3
2.0
JK Cement
Neutral
1,012
-
7,076
4,398
5,173
15.5
17.5
31.2
55.5
32.4
18.2
3.9
3.4
12.0
15.5
2.2
1.8
J K Lakshmi Cement
Neutral
495
-
5,829
2,913
3,412
14.5
19.5
7.5
22.5
66.1
22.0
4.1
3.4
12.5
18.0
2.6
2.2
Orient Cement
Neutral
150
-
3,072
2,114
2,558
18.5
20.5
8.1
11.3
18.5
13.3
2.7
2.3
9.0
14.0
2.1
1.6
UltraTech Cement
Neutral
4,116
-
112,984
25,768
30,385
21.0
23.5
111.0
160.0
37.1
25.7
4.7
4.1
13.5
15.8
4.5
3.7
Construction
ITNL
Neutral
96
-
3,173
8,946
10,017
31.0
31.6
8.1
9.1
11.9
10.6
0.4
0.4
4.2
5.0
3.7
3.4
KNR Constructions
Neutral
206
-
2,894
1,385
1,673
14.7
14.0
41.2
48.5
5.0
4.2
0.9
0.8
14.9
15.2
2.2
1.8
Larsen & Toubro
Neutral
1,727
-
161,178
111,017
124,908
11.0
11.0
61.1
66.7
28.3
25.9
3.4
3.2
13.1
12.9
2.5
2.3
Gujarat Pipavav Port
Neutral
153
-
7,416
705
788
52.2
51.7
5.0
5.6
30.7
27.4
3.0
2.7
11.2
11.2
10.2
8.6
Nagarjuna Const.
Neutral
90
-
5,017
8,842
9,775
9.1
8.8
5.3
6.4
17.0
14.1
1.4
1.2
8.2
9.1
0.7
0.6
PNC Infratech
Neutral
145
-
3,731
2,350
2,904
13.1
13.2
9.0
8.8
16.2
16.5
0.6
0.5
15.9
13.9
1.7
1.4
Simplex Infra
Neutral
507
-
2,507
6,829
7,954
10.5
10.5
31.4
37.4
16.1
13.6
1.7
1.5
9.9
13.4
0.8
0.7
Power Mech Projects
Neutral
603
-
886
1,801
2,219
12.7
14.6
72.1
113.9
8.4
5.3
1.5
1.3
16.8
11.9
0.5
0.4
Sadbhav Engineering
Neutral
305
-
5,224
3,598
4,140
10.3
10.6
9.0
11.9
33.8
25.6
3.5
3.1
9.9
11.9
1.7
1.5
NBCC
Neutral
201
-
18,063
7,428
9,549
7.9
8.6
8.2
11.0
24.5
18.3
1.2
1.0
28.2
28.7
2.1
1.6
MEP Infra
Neutral
92
-
1,492
1,877
1,943
30.6
29.8
3.0
4.2
30.6
21.9
14.8
10.0
0.6
0.6
2.2
2.0
Stock Watch
June 19, 2017
Company Name
Reco
CMP
Target
Mkt Cap
Sales ( Čcr )
OPM(%)
EPS (Č)
PER(x)
P/BV(x)
RoE(%)
EV/Sales(x)
(Č)
Price ( Č)
( Č cr )
FY17E
FY18E
FY17E
FY18E
FY17E
FY18E
FY17E
FY18E
FY17E
FY18E
FY17E
FY18E
FY17E
FY18E
Construction
SIPL
Neutral
111
-
3,926
1,036
1,252
65.5
66.2
(8.4)
(5.6)
4.2
4.8
(22.8)
(15.9)
12.0
10.0
Engineers India
Neutral
158
-
10,640
1,725
1,935
16.0
19.1
11.4
13.9
13.9
11.4
1.9
1.9
13.4
15.3
5.1
4.6
Financials
Axis Bank
Accumulate
510
580
122,238
46,932
53,575
3.5
3.4
32.4
44.6
15.8
11.4
2.0
1.8
13.6
16.5
-
-
Bank of Baroda
Neutral
168
-
38,721
19,980
23,178
1.8
1.8
11.5
17.3
14.6
9.7
1.7
1.4
8.3
10.1
-
-
Canara Bank
Neutral
352
-
21,028
15,225
16,836
1.8
1.8
14.5
28.0
24.3
12.6
1.7
1.4
5.8
8.5
-
-
Can Fin Homes
Neutral
3,141
-
8,362
420
526
3.5
3.5
86.5
107.8
36.3
29.1
7.8
6.4
23.6
24.1
-
-
Cholamandalam Inv. &
Accumulate
1,091
1,230
17,057
2,012
2,317
6.3
6.3
42.7
53.6
25.6
20.4
4.0
3.5
16.9
18.3
-
-
Fin. Co.
Dewan Housing Finance Accumulate
455
520
14,251
2,225
2,688
2.9
2.9
29.7
34.6
15.3
13.1
2.5
1.6
16.1
14.8
-
-
Equitas Holdings
Buy
156
235
5,288
939
1,281
11.7
11.5
5.8
8.2
27.0
19.1
2.3
2.1
10.9
11.5
-
-
Federal Bank
Neutral
121
-
20,864
8,259
8,995
3.0
3.0
4.3
5.6
28.1
21.6
2.4
2.2
8.5
10.1
-
-
HDFC
Neutral
1,639
-
260,514
11,475
13,450
3.4
3.4
45.3
52.5
36.2
31.2
7.0
6.2
20.2
20.5
-
-
HDFC Bank
Neutral
1,668
-
428,479
46,097
55,433
4.5
4.5
58.4
68.0
28.6
24.5
5.0
4.2
18.8
18.6
-
-
ICICI Bank
Neutral
317
-
184,515
42,800
44,686
3.1
3.3
18.0
21.9
17.6
14.5
2.4
2.2
11.1
12.3
-
-
Karur Vysya Bank
Accumulate
149
160
8,995
5,640
6,030
3.3
3.2
8.9
10.0
16.7
14.9
1.8
1.6
11.2
11.4
-
-
Lakshmi Vilas Bank
Neutral
198
-
3,794
3,339
3,799
2.7
2.8
11.0
14.0
18.0
14.1
1.9
1.7
11.2
12.7
-
-
LIC Housing Finance
Neutral
778
-
39,253
3,712
4,293
2.6
2.5
39.0
46.0
19.9
16.9
3.7
3.2
19.9
20.1
-
-
Punjab Natl.Bank
Neutral
147
-
31,377
23,532
23,595
2.3
2.4
6.8
12.6
21.7
11.7
3.4
2.4
3.3
6.5
-
-
RBL Bank
Neutral
515
-
19,387
1,783
2,309
2.6
2.6
12.7
16.4
40.6
31.4
4.4
4.0
12.8
13.3
-
-
Repco Home Finance
Neutral
893
-
5,585
388
457
4.5
4.2
30.0
38.0
29.8
23.5
5.0
4.2
18.0
19.2
-
-
South Ind.Bank
Neutral
30
-
5,320
6,435
7,578
2.5
2.5
2.7
3.1
10.9
9.5
1.4
1.2
10.1
11.2
-
-
St Bk of India
Neutral
286
-
231,820
88,650
98,335
2.6
2.6
13.5
18.8
21.2
15.2
2.0
1.8
7.0
8.5
-
-
Union Bank
Neutral
151
-
10,411
13,450
14,925
2.3
2.3
25.5
34.5
5.9
4.4
0.9
0.7
7.5
10.2
-
-
Yes Bank
Neutral
1,442
-
65,940
8,978
11,281
3.3
3.4
74.0
90.0
19.5
16.0
3.7
3.1
17.0
17.2
-
-
FMCG
Akzo Nobel India
Neutral
1,913
-
9,173
2,955
3,309
13.3
13.7
57.2
69.3
33.5
27.6
10.9
9.2
32.7
33.3
2.9
2.6
Asian Paints
Neutral
1,145
-
109,809
17,128
18,978
16.8
16.4
19.1
20.7
59.9
55.3
20.9
19.7
34.8
35.5
6.3
5.7
Britannia
Neutral
3,567
-
42,808
9,594
11,011
14.6
14.9
80.3
94.0
44.4
38.0
18.3
14.1
41.2
-
4.3
3.7
Colgate
Neutral
1,095
-
29,795
4,605
5,149
23.4
23.4
23.8
26.9
46.0
40.7
25.5
19.9
64.8
66.8
6.4
5.7
Dabur India
Accumulate
289
304
50,908
8,315
9,405
19.8
20.7
8.1
9.2
35.7
31.4
9.9
8.2
31.6
31.0
5.8
5.1
GlaxoSmith Con*
Neutral
5,360
-
22,542
4,350
4,823
21.2
21.4
179.2
196.5
29.9
27.3
7.9
6.7
27.1
26.8
4.6
4.0
Stock Watch
June 19, 2017
Company Name
Reco
CMP
Target
Mkt Cap
Sales ( Čcr )
OPM(%)
EPS (Č)
PER(x)
P/BV(x)
RoE(%)
EV/Sales(x)
(Č)
Price ( Č)
( Č cr )
FY17E FY18E
FY17E
FY18E
FY17E
FY18E
FY17E
FY18E
FY17E
FY18E
FY17E
FY18E
FY17E
FY18E
FMCG
Godrej Consumer
Neutral
1,868
-
63,611
10,235
11,428
18.4
18.6
41.1
44.2
45.4
42.3
10.1
8.5
24.9
24.8
6.3
5.6
HUL
Neutral
1,092
-
236,262
35,252
38,495
17.8
17.8
20.7
22.4
52.9
48.8
50.5
43.3
95.6
88.9
6.5
6.0
ITC
Neutral
306
-
372,074
40,059
44,439
38.3
39.2
9.0
10.1
34.1
30.2
9.5
8.3
27.8
27.5
8.8
7.9
Marico
Neutral
313
-
40,372
6,430
7,349
18.8
19.5
6.4
7.7
48.9
40.6
14.8
12.4
33.2
32.5
6.1
5.3
Nestle*
Neutral
6,759
-
65,169
10,073
11,807
20.7
21.5
124.8
154.2
54.2
43.8
22.2
20.0
34.8
36.7
6.3
5.3
Tata Global
Neutral
158
-
9,984
8,675
9,088
9.8
9.8
7.4
8.2
21.4
19.3
1.7
1.6
7.9
8.1
1.1
1.0
Procter & Gamble
Neutral
7,891
-
25,616
2,939
3,342
23.2
23.0
146.2
163.7
54.0
48.2
13.7
11.4
25.3
23.5
8.3
7.2
Hygiene
IT
HCL Tech^
Buy
839
1,014
119,724
46,723
52,342
22.1
20.9
60.0
62.8
14.0
13.4
3.5
3.0
25.3
22.4
2.3
2.0
Infosys
Buy
941
1,179
216,028
68,484
73,963
26.0
26.0
63.0
64.0
14.9
14.7
3.1
2.9
20.8
19.7
2.8
2.5
TCS
Accumulate
2,397
2,651
472,400
117,966
127,403
27.5
27.6
134.3
144.5
17.9
16.6
5.3
4.9
29.8
29.7
3.7
3.4
Tech Mahindra
Buy
391
533
38,064
29,141
31,051
14.4
15.0
32.3
35.6
12.1
11.0
2.1
1.9
17.1
17.0
1.2
1.0
Wipro
Accumulate
255
280
124,062
55,421
58,536
20.3
20.3
35.1
36.5
7.3
7.0
1.3
1.1
19.2
14.6
1.7
1.4
Media
D B Corp
Neutral
374
-
6,879
2,297
2,590
27.4
28.2
21.0
23.4
17.8
16.0
4.2
3.6
23.7
23.1
2.8
2.4
HT Media
Neutral
81
-
1,885
2,693
2,991
12.6
12.9
7.9
9.0
10.3
9.0
0.9
0.8
7.8
8.3
0.3
0.2
Jagran Prakashan
Buy
184
225
6,025
2,283
2,555
28.0
28.0
10.6
12.3
17.3
15.1
3.7
3.2
21.4
21.4
2.6
2.3
Sun TV Network
Neutral
840
-
33,085
2,850
3,265
70.1
71.0
26.2
30.4
32.0
27.6
8.2
7.2
24.3
25.6
11.2
9.6
Hindustan Media
Neutral
275
-
2,015
1,016
1,138
24.3
25.2
27.3
30.1
10.1
9.1
1.9
1.7
16.2
15.8
1.3
1.1
Ventures
TV Today Network
Buy
259
344
1,546
608
667
21.5
22.3
15.7
19.2
16.5
13.5
2.5
2.2
16.1
16.0
2.1
1.8
Metals & Mining
Coal India
Neutral
255
-
158,537
84,638
94,297
21.4
22.3
24.5
27.1
10.4
9.4
4.3
4.1
42.6
46.0
1.4
1.2
Hind. Zinc
Neutral
241
-
101,809
14,252
18,465
55.9
48.3
15.8
21.5
15.3
11.2
2.5
2.2
17.0
20.7
7.1
5.5
Hindalco
Neutral
195
-
43,791
107,899
112,095
7.4
8.2
9.2
13.0
21.2
15.0
1.0
1.0
4.8
6.6
0.9
0.9
JSW Steel
Neutral
195
-
47,148
53,201
58,779
16.1
16.2
130.6
153.7
1.5
1.3
0.2
0.2
14.0
14.4
1.6
1.4
NMDC
Neutral
112
-
35,546
6,643
7,284
44.4
47.7
7.1
7.7
15.8
14.6
1.4
1.3
8.8
9.2
3.1
2.8
SAIL
Neutral
57
-
23,500
47,528
53,738
(0.7)
2.1
(1.9)
2.6
21.9
0.6
0.6
(1.6)
3.9
1.3
1.2
Vedanta
Neutral
237
-
88,023
71,744
81,944
19.2
21.7
13.4
20.1
17.7
11.8
1.5
1.4
8.4
11.3
1.6
1.3
Tata Steel
Neutral
502
-
48,765
121,374
121,856
7.2
8.4
18.6
34.3
27.0
14.6
1.7
1.5
6.1
10.1
1.0
1.0
Oil & Gas
GAIL
Neutral
378
-
63,906
56,220
65,198
9.3
10.1
27.1
33.3
13.9
11.4
1.3
1.2
9.3
10.7
1.3
1.1
ONGC
Neutral
167
-
214,123
137,222
152,563
15.0
21.8
19.5
24.1
8.6
6.9
0.7
0.7
8.5
10.1
1.8
1.6
Indian Oil Corp
Neutral
405
-
196,470
373,359
428,656
5.9
5.5
54.0
59.3
7.5
6.8
1.2
1.0
16.0
15.6
0.7
0.6
Stock Watch
June 19, 2017
Company Name
Reco
CMP
Target
Mkt Cap
Sales ( Čcr )
OPM(%)
EPS (Č)
PER(x)
P/BV(x)
RoE(%)
EV/Sales(x)
(Č)
Price ( Č)
( Č cr )
FY17E FY18E
FY17E
FY18E
FY17E
FY18E
FY17E
FY18E
FY17E
FY18E
FY17E
FY18E
FY17E
FY18E
Oil & Gas
Reliance Industries
Neutral
1,388
-
451,250
301,963
358,039
12.1
12.6
87.7
101.7
15.8
13.7
1.6
1.5
10.7
11.3
2.0
1.6
Pharmaceuticals
Alembic Pharma
Buy
522
648
9,849
3,101
3,966
19.7
20.5
21.4
25.5
24.4
20.5
5.2
4.2
23.0
22.8
3.1
2.3
Alkem Laboratories Ltd
Accumulate
1,881
2,161
22,494
5,853
6,901
17.1
18.4
74.6
85.0
25.2
22.1
5.3
4.5
21.1
20.2
3.8
3.3
Aurobindo Pharma
Buy
653
823
38,238
14,845
17,086
21.5
22.1
39.4
44.7
16.6
14.6
4.1
3.2
27.6
24.7
2.7
2.3
Aventis*
Neutral
4,054
-
9,336
2,206
2,508
16.6
16.8
128.9
139.9
31.5
29.0
5.4
4.2
21.6
23.5
4.0
3.3
Cadila Healthcare
Reduce
525
450
53,787
9,220
11,584
18.4
20.3
14.5
18.7
36.2
28.1
7.7
6.3
23.5
24.6
6.2
4.7
Cipla
Reduce
537
461
43,209
14,281
16,619
15.4
16.2
12.5
19.7
43.0
27.3
3.4
3.1
8.4
12.0
3.2
2.7
Dr Reddy's
Neutral
2,677
-
44,366
14,081
15,937
16.1
18.6
72.6
105.9
36.9
25.3
3.6
3.3
9.6
13.6
3.4
3.0
Dishman Pharma
Sell
143
1,718
1,890
22.7
22.8
9.5
11.3
10.1
10.9
3.3
2.9
GSK Pharma*
Neutral
2,463
-
20,859
2,927
3,290
11.8
16.2
34.4
49.6
71.6
49.7
10.4
10.8
13.9
21.3
6.9
6.2
Indoco Remedies
Sell
189
153
1,737
1,067
1,154
12.1
14.9
8.4
11.3
22.5
16.7
2.7
2.4
12.6
15.0
1.8
1.7
Ipca labs
Buy
472
620
5,951
3,211
3,593
13.9
14.5
15.4
19.4
30.6
24.3
2.4
2.2
8.2
9.5
2.0
1.7
Lupin
Buy
1,131
1,526
51,087
17,120
18,657
24.1
24.1
56.9
61.1
19.9
18.5
3.8
3.2
20.7
18.6
3.3
2.7
Natco Pharma
Accumulate
989
1,060
17,245
2,065
1,988
33.1
33.7
27.9
25.7
35.5
38.5
10.3
8.8
29.2
22.9
8.4
8.5
Sun Pharma
Buy
529
712
126,955
30,264
32,899
29.0
26.9
32.7
31.6
16.2
16.8
3.5
3.0
22.2
18.7
3.9
3.5
Power
Tata Power
Neutral
78
-
21,070
36,916
39,557
17.4
27.1
5.1
6.3
15.3
12.4
1.3
1.2
9.0
10.3
1.6
1.4
NTPC
Neutral
160
-
132,134
86,605
95,545
17.5
20.8
11.8
13.4
13.6
12.0
1.4
1.3
10.5
11.1
2.9
2.9
Power Grid
Accumulate
210
223
109,602
25,315
29,193
88.2
88.7
14.2
17.2
14.8
12.2
2.3
2.0
15.2
16.1
9.0
8.1
Real Estate
Prestige Estate
Neutral
266
-
9,984
4,707
5,105
25.2
26.0
10.3
13.0
25.9
20.5
2.1
1.9
10.3
10.2
3.3
2.9
MLIFE
Buy
440
522
2,257
1,152
1,300
22.7
24.6
29.9
35.8
14.7
12.3
1.1
1.0
7.6
8.6
2.7
2.3
Telecom
Bharti Airtel
Neutral
365
-
145,805
105,086
114,808
34.5
34.7
12.2
16.4
29.9
22.2
2.0
1.9
6.8
8.4
2.3
2.0
Idea Cellular
Neutral
78
-
28,037
40,133
43,731
37.2
37.1
6.4
6.5
12.2
12.0
1.0
0.9
8.2
7.6
1.7
1.5
zOthers
Abbott India
Neutral
4,215
-
8,958
3,153
3,583
14.1
14.4
152.2
182.7
27.7
23.1
136.0
116.1
25.6
26.1
2.6
2.2
Asian Granito
Accumulate
415
447
1,249
1,066
1,169
11.6
12.5
13.0
16.0
31.9
26.0
3.1
2.8
9.5
10.7
1.5
1.3
Bajaj Electricals
Accumulate
345
395
3,489
4,801
5,351
5.7
6.2
10.4
13.7
33.1
25.2
4.1
3.6
12.4
14.5
0.7
0.6
Banco Products (India)
Neutral
224
-
1,605
1,353
1,471
12.3
12.4
14.5
16.3
15.5
13.8
21.4
19.3
14.5
14.6
1.1
121.1
Coffee Day Enterprises
Neutral
246
-
5,065
2,964
3,260
20.5
21.2
4.7
8.0
-
30.7
2.8
2.6
5.5
8.5
2.1
1.9
Ltd
Competent Automobiles Neutral
201
-
129
1,137
1,256
3.1
2.7
28.0
23.6
7.2
8.5
38.6
34.9
14.3
11.5
0.1
0.1
Elecon Engineering
Neutral
61
-
681
1,482
1,660
13.7
14.5
3.9
5.8
15.6
10.5
3.7
3.4
7.8
10.9
0.8
0.7
Stock Watch
June 19, 2017
Company Name
Reco
CMP
Target
Mkt Cap
Sales ( Čcr )
OPM(%)
EPS (Č)
PER(x)
P/BV(x)
RoE(%)
EV/Sales(x)
(Č)
Price ( Č)
( Č cr )
FY17E
FY18E
FY17E
FY18E
FY17E
FY18E
FY17E
FY18E
FY17E
FY18E
FY17E
FY18E
FY17E
FY18E
zOthers
Finolex Cables
Neutral
495
-
7,570
2,883
3,115
12.0
12.1
14.2
18.6
34.9
26.6
18.5
16.2
15.8
14.6
2.3
2.1
Garware Wall Ropes
Neutral
841
-
1,841
863
928
15.1
15.2
36.4
39.4
23.1
21.4
4.2
3.6
17.5
15.9
2.0
1.9
Goodyear India*
Neutral
871
-
2,009
1,598
1,704
10.4
10.2
49.4
52.6
17.6
16.6
81.4
71.4
18.2
17.0
0.9
134.2
Hitachi
Neutral
2,113
-
5,744
2,081
2,433
8.8
8.9
33.4
39.9
63.3
52.9
51.0
42.5
22.1
21.4
2.8
2.3
HSIL
Neutral
379
-
2,739
2,384
2,515
15.8
16.3
15.3
19.4
24.8
19.5
24.6
21.2
7.8
9.3
1.3
1.2
Interglobe Aviation
Neutral
1,212
-
43,828
21,122
26,005
14.5
27.6
110.7
132.1
11.0
9.2
65.5
46.8
168.5
201.1
2.1
1.6
Jyothy Laboratories
Neutral
375
-
6,811
1,440
2,052
11.5
13.0
8.5
10.0
44.1
37.5
10.7
9.9
18.6
19.3
5.0
3.5
Kirloskar Engines India
Neutral
385
-
5,568
2,554
2,800
9.9
10.0
10.5
12.1
36.7
31.8
15.3
14.5
10.7
11.7
1.8
1.6
Ltd
Linc Pen & Plastics
Neutral
285
-
422
382
420
9.3
9.5
13.5
15.7
21.2
18.2
3.6
3.1
17.1
17.3
1.2
1.1
M M Forgings
Neutral
624
-
753
546
608
20.4
20.7
41.3
48.7
15.1
12.8
85.5
75.6
16.6
17.0
1.2
1.1
Manpasand Bever.
Neutral
781
-
4,471
836
1,087
19.6
19.4
16.9
23.8
46.3
32.8
5.6
4.9
12.0
14.8
5.1
3.8
Mirza International
Neutral
162
-
1,947
963
1,069
17.2
18.0
6.1
7.5
26.4
21.6
4.0
3.4
15.0
15.7
2.2
2.0
MT Educare
Neutral
64
-
253
366
417
17.7
18.2
9.4
10.8
6.8
5.9
1.5
1.3
22.2
22.3
0.6
0.5
Narayana Hrudaya
Neutral
320
-
6,542
1,873
2,166
11.5
11.7
2.6
4.0
121.0
80.7
7.4
6.7
6.1
8.3
3.6
3.1
Navkar Corporation
Buy
221
265
3,146
347
371
43.2
37.3
6.7
6.0
33.1
36.8
2.3
2.0
6.2
10.6
10.2
9.5
Navneet Education
Neutral
186
-
4,347
1,062
1,147
24.0
24.0
6.1
6.6
30.6
28.1
6.3
5.6
20.6
19.8
4.2
3.9
Nilkamal
Neutral
1,989
-
2,968
1,995
2,165
10.7
10.4
69.8
80.6
28.5
24.7
113.6
98.7
16.6
16.5
1.5
1.3
Page Industries
Neutral
16,579
-
18,492
2,450
3,124
20.1
17.6
299.0
310.0
55.5
53.5
369.2
281.9
47.1
87.5
7.6
6.0
Parag Milk Foods
Neutral
216
-
1,818
1,919
2,231
9.3
9.6
9.5
12.9
22.9
16.7
3.6
2.9
15.5
17.5
1.1
0.9
Quick Heal
Neutral
212
-
1,483
408
495
27.3
27.0
7.7
8.8
27.3
24.1
2.5
2.5
9.3
10.6
2.8
2.3
Radico Khaitan
Buy
127
147
1,690
1,667
1,824
13.0
13.2
6.7
8.2
19.1
15.5
1.7
1.6
9.0
10.2
1.4
1.3
Relaxo Footwears
Neutral
486
-
5,834
2,085
2,469
9.2
8.2
7.6
8.0
64.2
61.1
24.9
21.3
17.9
18.8
2.9
2.5
S H Kelkar & Co.
Neutral
292
-
4,224
1,036
1,160
15.1
15.0
6.1
7.2
47.8
40.7
5.1
4.7
10.7
11.5
3.9
3.5
Siyaram Silk Mills
Accumulate
2,240
2,500
2,100
1,574
1,769
12.5
12.7
97.1
113.1
23.1
19.8
3.5
3.1
15.4
15.5
1.5
1.4
Styrolution ABS India*
Neutral
855
-
1,503
1,440
1,537
9.2
9.0
40.6
42.6
21.1
20.1
53.8
48.9
12.3
11.6
1.0
0.9
Surya Roshni
Neutral
284
-
1,243
3,342
3,625
7.8
7.5
17.3
19.8
16.4
14.4
31.2
25.0
10.5
10.8
0.6
0.6
Team Lease Serv.
Neutral
1,323
-
2,262
3,229
4,001
1.5
1.8
22.8
32.8
58.1
40.3
6.2
5.4
10.7
13.4
0.6
0.5
The Byke Hospitality
Neutral
189
-
759
287
384
20.5
20.5
7.6
10.7
24.9
17.7
5.2
4.2
20.7
23.5
2.7
2.0
Transport Corporation of
Neutral
311
-
2,378
2,671
2,911
8.5
8.8
13.9
15.7
22.4
19.8
3.1
2.7
13.7
13.8
1.0
0.9
India
Stock Watch
June 19, 2017
Company Name
Reco
CMP
Target Mkt Cap
Sales ( Čcr )
OPM(%)
EPS (Č)
PER(x)
P/BV(x)
RoE(%)
EV/Sales(x)
(Č)
Price ( Č)
( Č cr )
FY17E FY18E FY17E FY18E FY17E FY18E FY17E FY18E FY17E FY18E FY17E FY18E FY17E FY18E
zOthers
TVS Srichakra
Neutral
3,925
-
3,005
2,304
2,614
13.7
13.8
231.1
266.6
17.0
14.7
441.0
347.2
33.9
29.3
1.3
1.1
UFO Moviez
Neutral
416
-
1,148
619
685
33.2
33.4
30.0
34.9
13.9
11.9
1.9
1.7
13.8
13.9
1.6
1.2
Visaka Industries
Neutral
512
-
813
1,051
1,138
10.3
10.4
21.0
23.1
24.4
22.1
65.6
61.4
9.0
9.2
1.0
1.0
VRL Logistics
Neutral
323
-
2,943
1,902
2,119
16.7
16.6
14.6
16.8
22.1
19.2
4.9
4.3
21.9
22.2
1.7
1.5
VIP Industries
Accumulate
195
218
2,750
1,270
1,450
10.4
10.4
5.6
6.5
34.8
29.9
7.2
6.3
20.7
21.1
2.2
1.9
Navin Fluorine
Buy
3,150
3,650
3,084
789
945
21.1
22.4
120.1
143.4
26.2
22.0
4.2
3.6
17.8
18.5
3.8
3.1
Source: Company, Angel Research; Note: *December year end; #September year end; &October year end; Price as on June 16, 2017
Market Outlook
June 19, 2017
Research Team Tel: 022 - 39357800
DISCLAIMER
Angel Broking Private Limited (hereinafter referred to as “Angel”) is a registered Member of National Stock Exchange of India
Limited,Bombay Stock Exchange Limited and Metropolitan Stock Exchange Limited. It is also registered as a Depository Participant with
CDSL and Portfolio Manager with SEBI. It also has registration with AMFI as a Mutual Fund Distributor. Angel Broking Private Limited is a
registered entity with SEBI for Research Analyst in terms of SEBI (Research Analyst) Regulations, 2014 vide registration number
INH000000164. Angel or its associates has not been debarred/ suspended by SEBI or any other regulatory authority for accessing
/dealing in securities Market. Angel or its associates/analyst has not received any compensation / managed or
co-managed public offering of securities of the company covered by Analyst during the past twelve months.
This document is solely for the personal information of the recipient, and must not be singularly used as the basis of any investment
decision. Nothing in this document should be construed as investment or financial advice. Each recipient of this document should make
such investigations as they deem necessary to arrive at an independent evaluation of an investment in the securities of the companies
referred to in this document (including the merits and risks involved), and should consult their own advisors to determine the merits and
risks of such an investment.
Reports based on technical and derivative analysis center on studying charts of a stock's price movement, outstanding positions and
trading volume, as opposed to focusing on a company's fundamentals and, as such, may not match with a report on a company's
fundamentals. Investors are advised to refer the Fundamental and Technical Research Reports available on our website to evaluate the
contrary view, if any.
The information in this document has been printed on the basis of publicly available information, internal data and other reliable
sources believed to be true, but we do not represent that it is accurate or complete and it should not be relied on as such, as this
document is for general guidance only. Angel Broking Pvt. Limited or any of its affiliates/ group companies shall not be in any way
responsible for any loss or damage that may arise to any person from any inadvertent error in the information contained in this report.
Angel Broking Pvt. Limited has not independently verified all the information contained within this document. Accordingly, we cannot
testify, nor make any representation or warranty, express or implied, to the accuracy, contents or data contained within this document.
While Angel Broking Pvt. Limited endeavors to update on a reasonable basis the information discussed in this material, there may be
regulatory, compliance, or other reasons that prevent us from doing so.
This document is being supplied to you solely for your information, and its contents, information or data may not be reproduced,
redistributed or passed on, directly or indirectly.
Neither Angel Broking Pvt. Limited, nor its directors, employees or affiliates shall be liable for any loss or damage that may arise from
or in connection with the use of this information.